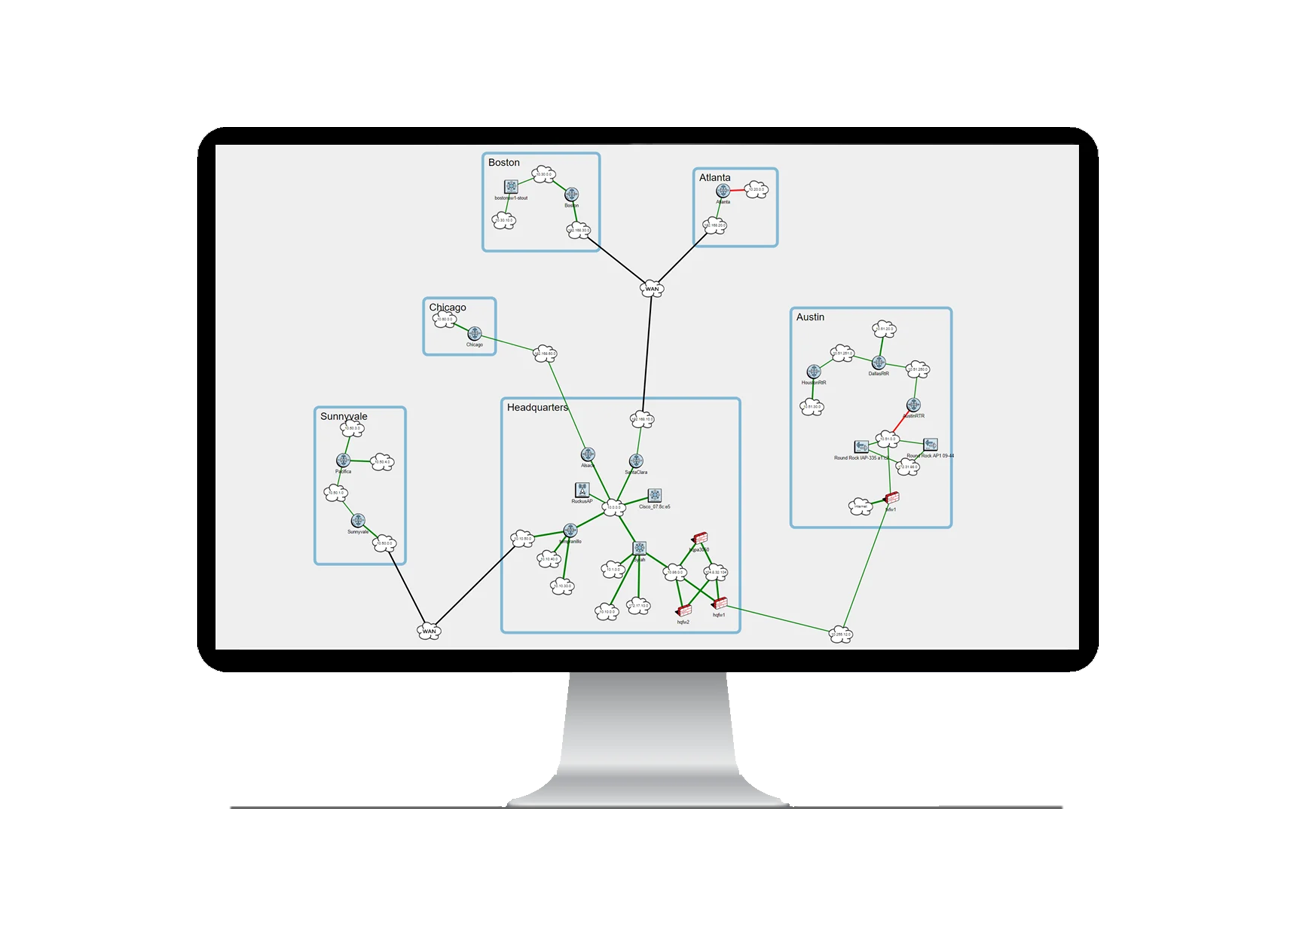
Network glitches occur and your users get frustrated — Why does SolarWinds say that the network is healthy?
SolarWinds will tell you about outages and show you utilization graphs on a few interfaces, but it really can’t help you troubleshoot problems because it doesn’t have enough information to know what’s actually wrong.
Both platforms collect network data and generate alerts. The key distinction is how efficiently they translate that data into actionable root-cause insight.
| Capability | TotalView | SolarWinds Orion |
| Deployment time | Hours | Weeks-months |
| Root-cause diagnosis | Built-in heuristics engine | Manual analysis |
| Servers required | 1 server | Multiple servers + SQL |
| Modules required | None | NPM, NCM, NTA, IPAM, etc |
| Path analysis | Native | Manual |
| Licensing model | Perpetual or Subscription | Subscription only |
TotalView automatically collects configuration, performance metrics, and 19 interface error counters across every device — enabling the platform to identify the actual cause of issues that SolarWinds simply reports as alerts.
Traditional monitoring tools like SolarWinds show you metrics.
Most deployments have between 3 and 10 servers that have to be supported for the system to operate.
This reduces support and licensing requirements (and makes it a lot easier to upgrade).
all core network monitoring is included.
info@pathsolutions.com
©2026 PathSolutions Inc. All rights reserved.