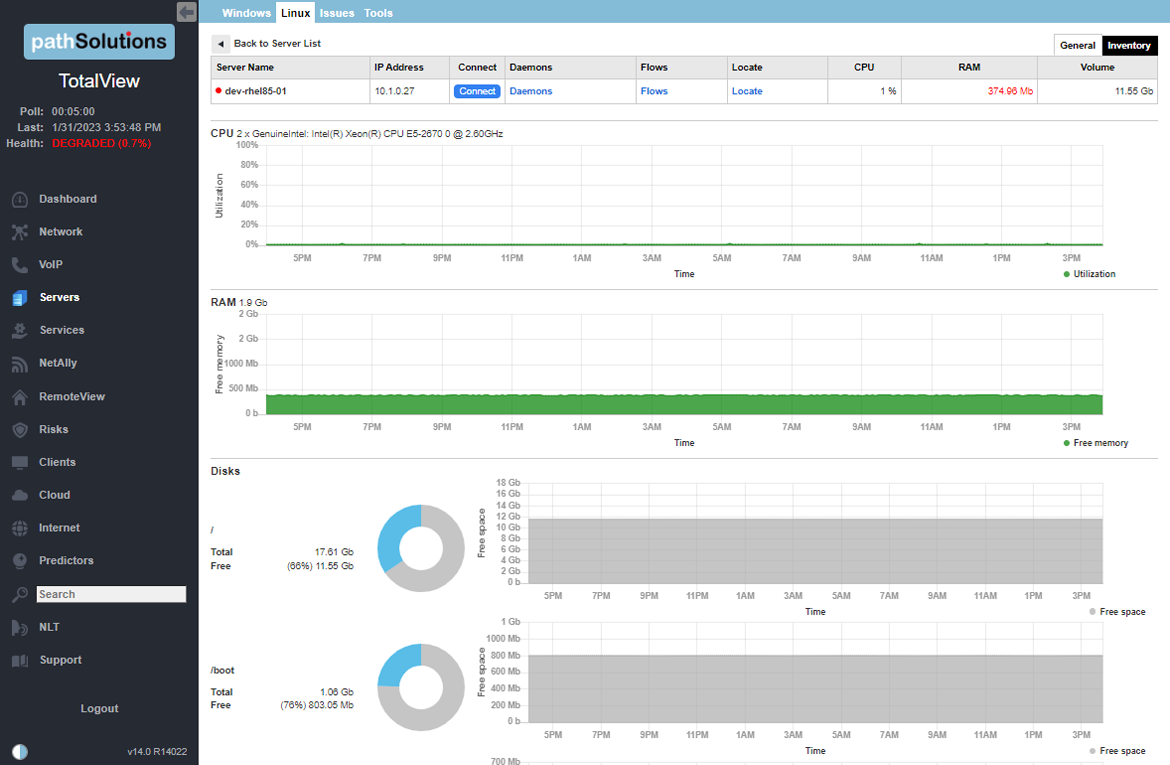
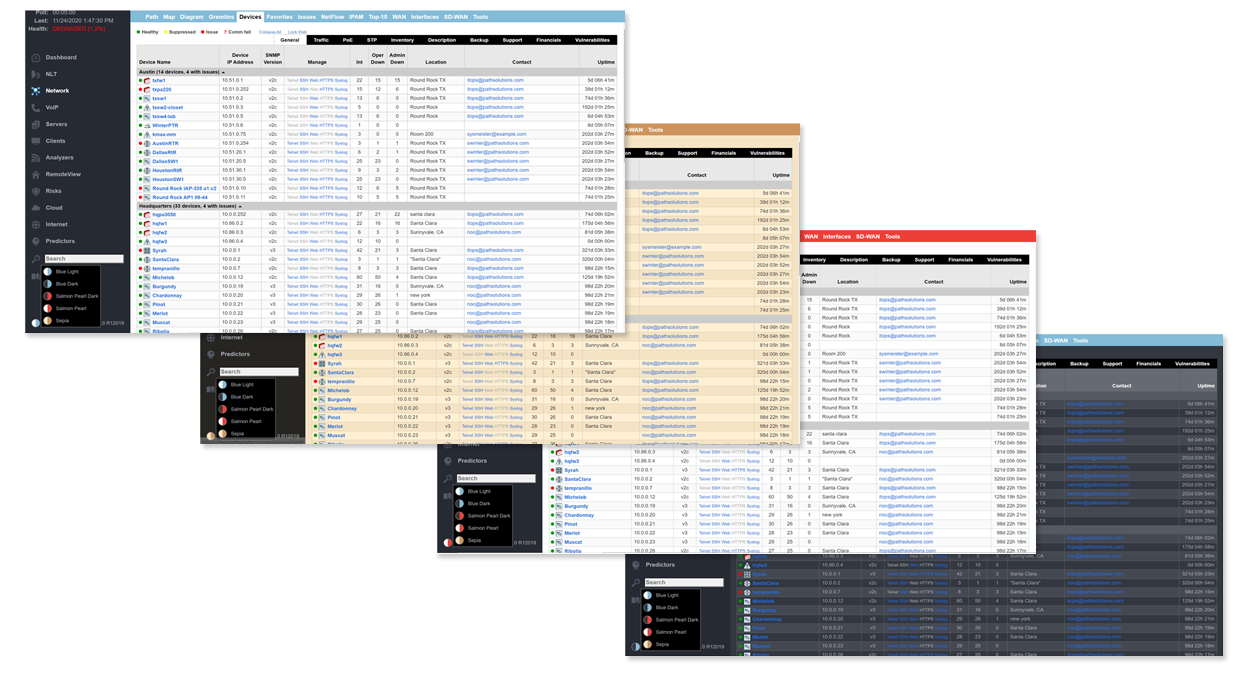
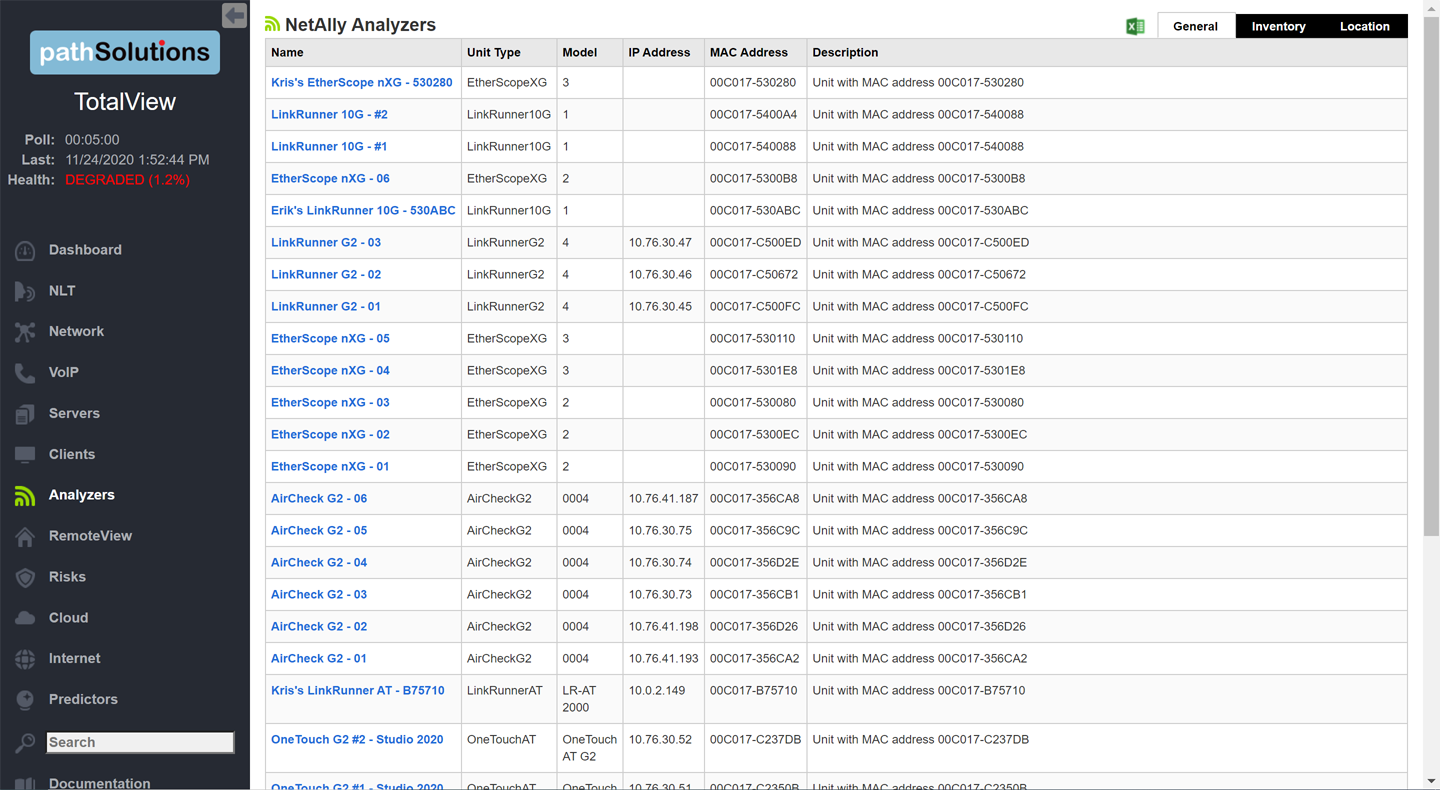
A single virtual machine can monitor networks as large as 100,000 interfaces*. Windows server OS or desktop OS, 4GB of RAM, and 20GB of storage space are all you need.
TotalView is coded in C and C++, helping keep the system efficient in energy use, memory use, and execution time.
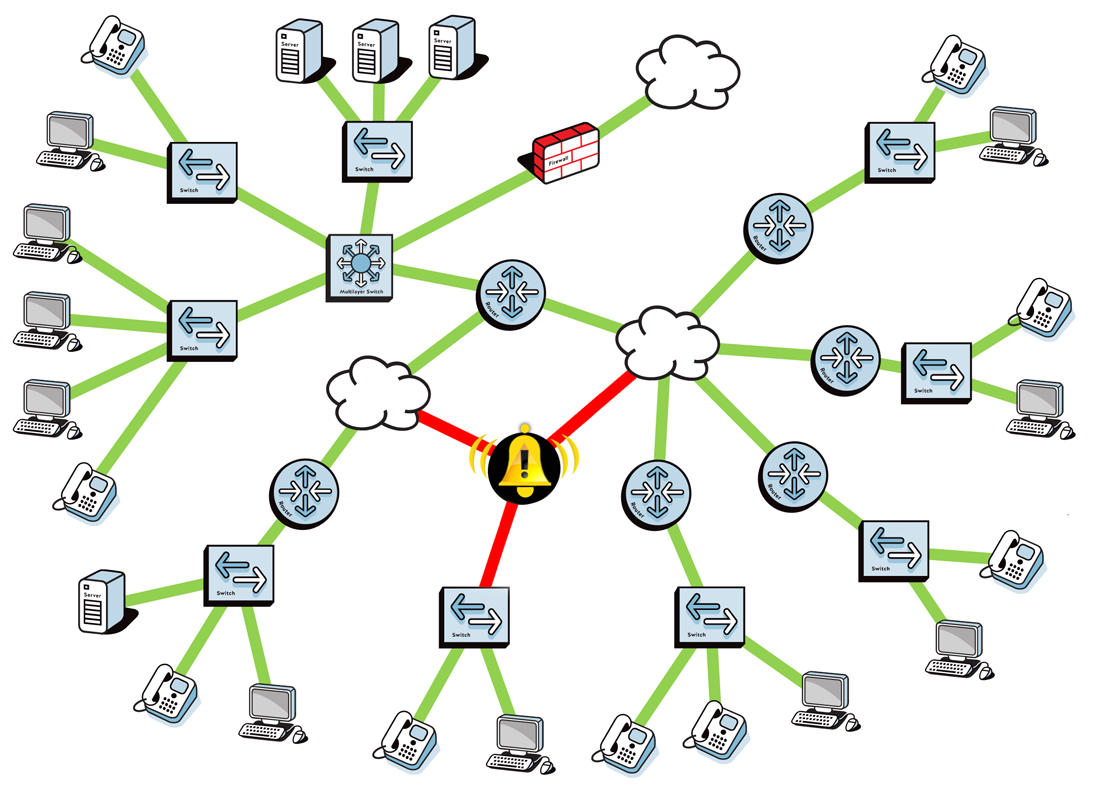
It is also lightweight because SNMP requests and replies are optimized to minimize packet volume and spread out to avoid impacting network devices.
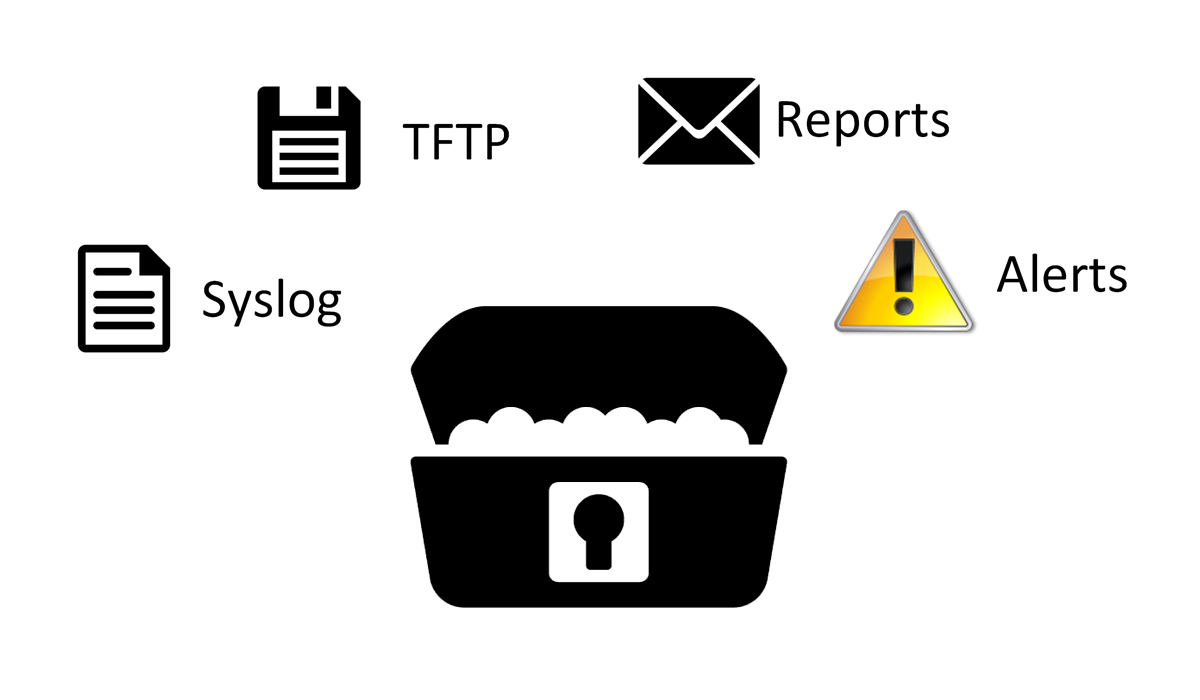
• We don’t need a web server.
• We don’t need a separate database.
• We don’t need .NET.
• We don’t need Java.
This lightweight footprint makes TotalView easier to support and manage as network monitoring software for large environments.
*Over 200,000 interfaces are supported with a single physical server.