



Network performance monitoring (NPM) is the continuous collection, analysis, and alerting of network metrics: latency, packet loss, jitter, bandwidth utilization, and uptime to detect and resolve issues before they affect users.
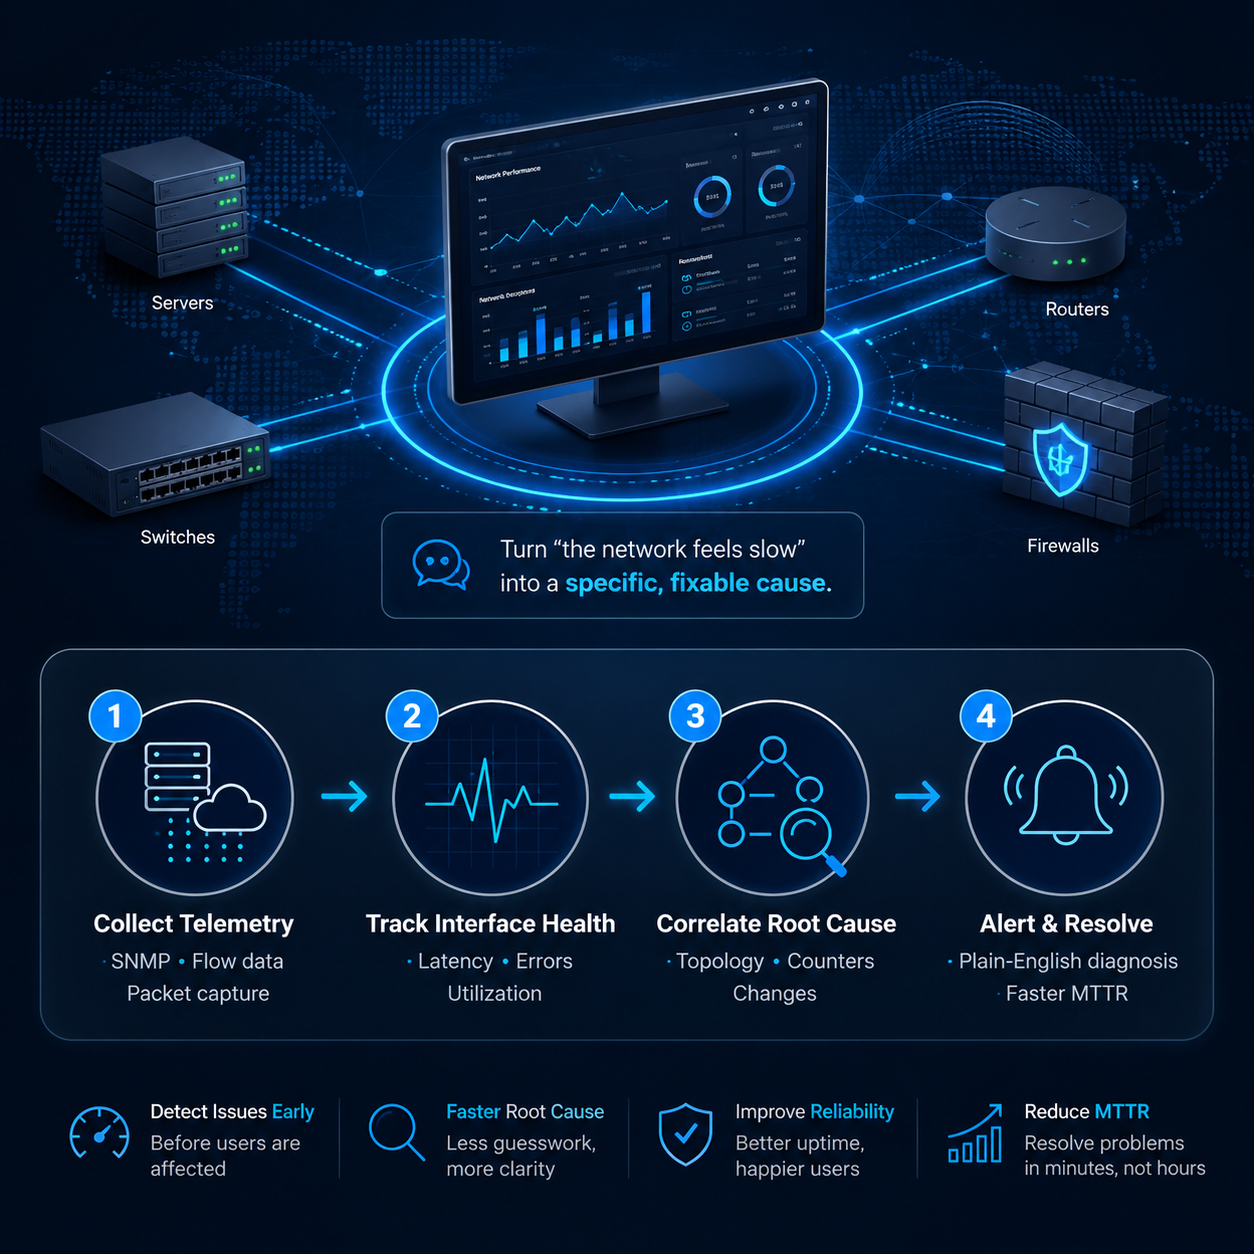
Network performance monitoring tools pull data from routers, switches, firewalls, and servers to give IT teams a real-time view of network health, turning "the network feels slow" into "port 12 on Switch-3 is failing" in minutes instead of hours.
|
Key Takeaways
|
Network Monitoring vs. NPM vs. APM
These terms get used interchangeably, but they answer three different questions:
|
Term |
Primary Question |
Focus |
|
"Is the device up or down?" |
Basic availability and status |
|
|
Network Performance Monitoring (NPM) |
"How well is the network performing?" |
Latency, packet loss, jitter, bandwidth, root cause |
|
Application Performance Monitoring (APM) |
"Why is this application slow?" |
Code-level and transaction-level behavior |
A switch can show a healthy green light and still be dropping packets, running near capacity, or adding just enough latency to break a VoIP call.
NPM lives in that gray zone between "working" and "broken," and NPM and APM typically work together: NPM tells you whether the network is the bottleneck; APM tells you whether the application is.
Why Network Performance Monitoring Matters
Gartner's widely cited benchmark puts the average cost of IT downtime at roughly $5,600 per minute, and recent industry surveys find over 90% of mid-size and large enterprises report downtime costs exceeding $300,000 per hour. Network issues, not application bugs, are consistently among the leading causes.
That risk is driving real market growth: independent research puts the global NPM market at roughly $3.3–3.4 billion in 2025–2026, growing 7–9% annually through the early 2030s, driven by distributed infrastructure (multi-cloud, SD-WAN, remote work), zero-tolerance real-time apps (VoIP, video, SaaS), and growing overlap between NetOps and SecOps telemetry.
How Network Performance Monitoring Works
NPM comes down to a four-stage loop:
1. Data collection. Tools draw from three telemetry sources, and strong deployments rarely rely on just one:
- SNMP: Polls routers, switches, and servers for CPU load, interface status, and error counters. Nearly every enterprise device supports it out of the box.
- Flow data (NetFlow, sFlow, IPFIX): Aggregates traffic into flow records showing which apps, IPs, and protocols are consuming bandwidth, without inspecting every packet.
- Packet capture (PCAP): Raw, protocol-level inspection the deepest and most resource-intensive source, typically reserved for troubleshooting a specific issue.
2. Interface and error-counter auditing. Advanced platforms go beyond "up or down" to track CRC errors, alignment errors, FCS anomalies, and micro-bursts early signals of hardware degradation before it fails outright.
3. Correlation and root cause analysis. Correlation engines cross-reference error counters, topology maps, and configuration changes to produce a plain-English explanation: "port 12 on Switch-3 is showing rising CRC errors consistent with a failing cable" instead of a wall of syslog output. This step drives MTTR down the most.
4. Alerting and visualization. Once a metric crosses a threshold, the system notifies the right team with enough context to act immediately.
Key Network Performance Metrics to Track
|
Metric |
What It Measures |
Why It Matters |
|
Latency |
Time for data to travel from source to destination (ms) |
High latency degrades VoIP and video conferencing |
|
Packet Loss |
% of packets that never arrive |
Even 1–2% loss can make calls unusable |
|
Jitter |
Variation in packet delay over time |
Causes choppy audio/video even when average latency looks fine |
|
Bandwidth Utilization |
% of available capacity in use |
Sustained high use signals a need for capacity planning |
|
Throughput |
Actual data transferred over time |
Reveals real-world capacity, not just theoretical max |
|
Uptime/Availability |
% of time a device or link is operational |
The baseline SLA metric most businesses report on |
Latency, jitter, and packet loss are what make a Zoom call fall apart in real time. Bandwidth utilization and throughput tell you when it's time to plan an upgrade before that happens.
Types of Network Performance Monitoring Tools
|
Approach |
Data Source |
Strength |
Trade-Off |
|
SNMP-based |
Device polling |
Broad coverage, low overhead |
Point-in-time snapshots only |
|
Flow-based (NetFlow/sFlow/IPFIX) |
Flow records |
Scales well, shows bandwidth by app/IP |
Aggregated, less granular than packet inspection |
|
Packet-based (DPI/PCAP) |
Raw packet capture |
Deepest, protocol-level detail |
Resource-intensive at scale |
The strongest strategies layer all three: SNMP for broad device health, flow data for ongoing traffic visibility, and packet capture for root-cause depth when needed.
|
Active monitoring sends synthetic test traffic to proactively validate a path is ready. Passive monitoring observes real production traffic to reflect genuine user experience. Most enterprise deployments use both. |
How to Choose an NPM Solution
- Does it monitor every interface automatically, or require manually selecting ports? Manual selection creates blind spots.
- Does it combine SNMP, flow, and packet-level data or just one?
- Does it explain root cause in plain language, or just surface raw metrics?
- Does it cover remote and cloud environments, not just on-prem?
- Does it support VoIP/UC diagnostics (jitter, call-path testing)?
- How is historical data retained and priced as retention grows?
- How much tuning does it need to avoid alert fatigue?
Best Practices and Common Mistakes
Do:
- Monitor every connected interface automatically; the outage usually starts at the device nobody thought to watch.
- Use dynamic, baseline-driven thresholds instead of static ones that trigger false alarms during normal traffic swings.
- Correlate performance data with vendor end-of-life (EoX) notices so aging hardware gets replaced before it fails.
- Combine SNMP, flow, and packet capture rather than relying on one source.
- Review and retune monitoring configurations regularly.
Avoid:
- Static alert thresholds, which cause alert fatigue and get muted, including the alerts that matter.
- Treating NPM as a one-time setup rather than an ongoing process.
- Ignoring interface error counters; uptime alone hides early signs like rising CRC or FCS errors.
- Choosing a tool based on dashboards alone; test diagnostic depth, not just the UI.
The Future of NPM: AI, Automation, and AIOps
The next phase of NPM isn't about collecting more data; most teams already have more than they can read. It's about interpreting it automatically. AI-assisted correlation engines can already turn thousands of raw error counters into one plain-English explanation of what broke and why. Not every tool wearing the "AIOps" label delivers on that; ask a vendor to demonstrate root cause output on a real network issue, not a staged demo.
Where this is heading: predictive alerting that flags a likely failure before a threshold is crossed, unified NetOps/SecOps platforms treating performance and security telemetry as one dataset, and deeper cloud and SD-WAN visibility as more traffic moves off traditional on-prem infrastructure.
Conclusion
Network performance monitoring gives IT teams continuous, real-time visibility into how a network is actually performing, not just whether it's online. Tracking latency, packet loss, jitter, and bandwidth, and correlating that data into a clear root cause, is what shortens resolution time and cuts outages before they start.
The teams that get the most out of NPM aren't the ones with the most dashboards; they're the ones who trust the data enough to act on it before the help desk tickets roll in.
CTA
Curious what's actually happening on your network right now, down to the interface level? Request a live TotalView demo and get a plain-English root cause the next time something breaks instead of a wall of raw logs.
Frequently Asked Questions
1. What is network performance monitoring in simple terms?
The ongoing process of tracking how well a network performs speed, reliability, packet loss so problems get caught and fixed before users notice.
2. What's the difference between network monitoring and network performance monitoring?
Network monitoring checks whether a device is online. NPM measures how well it's performing: latency, jitter, packet loss, bandwidth, even when the device shows as "up."
3. What metrics should I monitor first?
Latency, packet loss, jitter, bandwidth utilization, and uptime. Together they cover both real-time application quality and general network health.
4. Is NPM only for large enterprises?
No. Any organization running VoIP, cloud tools, or remote access benefits. Cloud-based, subscription-priced tools have made NPM accessible to small IT teams too.
5. How is NPM different from a network performance audit?
An audit is a point-in-time snapshot of current health and risk. NPM is the continuous version of that same question. Many organizations run an audit first to set a baseline, then put continuous NPM in place to maintain it.



.webp)
.jpg)