



A cloud application can be healthy and still feel painfully slow to the people using it.
That is because the application is only one part of the connection. Before a request reaches a cloud service, it may pass through a wireless network, switch, firewall, WAN circuit, internet provider, DNS resolver, cloud gateway, route table, and load balancer.
A problem at any one of those points can affect performance without triggering an application outage.
Cloud-based network monitoring gives IT teams visibility across that chain. It tracks the devices, interfaces, routes, traffic flows, connections, and service paths involved in cloud access so engineers can determine where degradation begins and what is likely causing it.
This guide explains:
- How cloud network monitoring works
- How it differs from cloud network management
- Which signals matter, and what organizations should look for when evaluating a monitoring platform.
Let’s dive in.
Key Takeaways
|
What Is Cloud-Based Network Monitoring?
Cloud-based network monitoring is the process of tracking the availability, traffic, routes, devices, interfaces, and performance of the networks that connect users to cloud services.
It helps IT teams determine whether a problem originates in the local network, WAN, internet provider, DNS service, network path, cloud environment, or application connection.
The term can refer to a monitoring platform hosted in the cloud or to the monitoring of networks used to reach cloud-hosted services. These are not necessarily the same. A cloud-hosted platform may monitor both local and cloud infrastructure, while an on-premises platform may still monitor SaaS applications and public cloud service paths.
Unlike full-stack cloud observability, which may cover applications, databases, servers, logs, traces, and containers, cloud network monitoring focuses on connectivity. Its purpose is to show whether traffic can reach a service, how well the connection is performing, and where network degradation may be occurring.
That requires visibility into both the service and the network route used to reach it, which is a central part of effective cloud service monitoring.
How Does Cloud Networking Work?
Cloud networking connects users, offices, applications, and on-premises infrastructure to resources hosted in public, private, or hybrid cloud environments. It combines virtual networks with physical connections such as internet circuits, WAN links, VPNs, and private cloud connections.
Public cloud platforms organize these resources inside isolated networks such as an Amazon Virtual Private Cloud or an Azure Virtual Network.
A typical cloud connection follows these steps:
- A user sends a request: The connection begins on a local wired, wireless, branch, or remote network.
- Enterprise devices direct the traffic: Switches, routers, firewalls, or SD-WAN appliances forward the request toward the appropriate provider or cloud service.
- DNS resolves the service address: The domain name is translated into the IP address required to establish the connection.
- A WAN or internet provider carries the traffic: The request may cross several external networks before it reaches the cloud provider.
- A cloud gateway receives the connection: An internet gateway, VPN gateway, private connection, or similar service connects the traffic to the cloud network.
- Cloud routing sends the request to the correct destination: Route tables determine where traffic from a subnet, interface, or gateway should go.
- Security and delivery services process the traffic: Firewalls, access policies, security controls, and load balancers determine whether and how the request reaches the application.
A slowdown can begin at any of these stages. Cloud network monitoring observes the full connection so teams can determine whether the problem is in the enterprise network, along the provider path, within cloud routing, or at the destination service.
How Does Cloud-Based Network Monitoring Work?
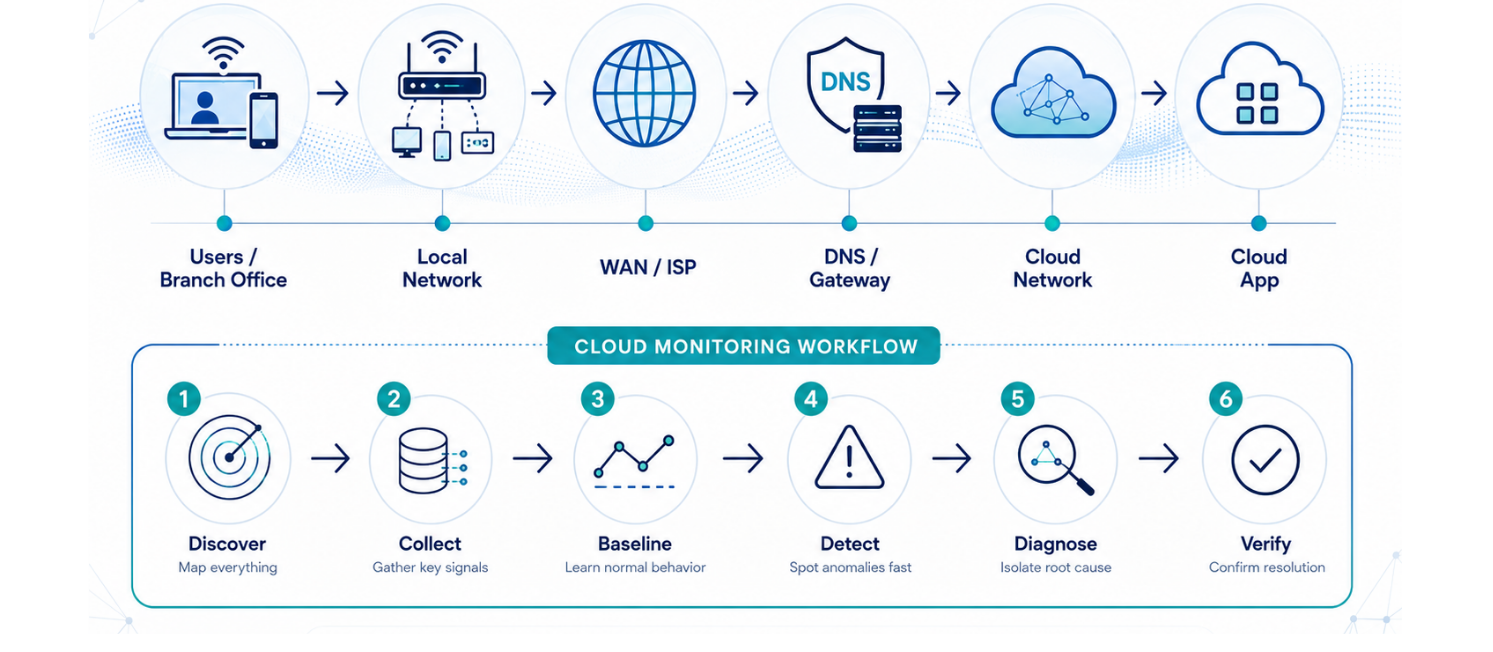
A dashboard is only the visible layer of a monitoring system. The real value comes from how the platform discovers resources, collects telemetry, establishes normal performance, and connects related events during an incident.
1. Discover Resources and Dependencies
Start by identifying the devices, services, and connections that support the cloud application. This may include routers, switches, firewalls, WAN links, SD-WAN appliances, DNS systems, virtual networks, branch offices, and remote users. A device list is not enough. The platform should also map dependencies so it can recognize when one upstream failure is causing several downstream alerts.
2. Collect Active and Passive Telemetry
Use both passive and active monitoring. Passive monitoring collects existing network data such as SNMP statistics, flow records, syslog messages, routes, configuration changes, and cloud API data. NetFlow bandwidth monitoring can show which systems are communicating and how much traffic they generate, while AWS VPC Flow Logs provide visibility into traffic entering and leaving virtual interfaces.
Active monitoring uses controlled DNS, ICMP, TCP, or HTTP tests to measure reachability, latency, packet loss, and response time. The IETF classification of active, passive, and hybrid measurement methods explains how these approaches differ.
Active tests show what users experience. Passive data helps explain why. The strongest monitoring approach combines both.
3. Establish a Performance Baseline
Define what normal performance looks like for each service, site, route, and time of day. Baselines help teams distinguish expected traffic peaks from unusual latency, packet loss, congestion, or route changes. They should reflect the actual environment rather than generic thresholds.
4. Detect and Prioritize Problems
Compare current conditions with baselines, thresholds, and service objectives. The platform may detect latency, packet loss, interface errors, bandwidth saturation, DNS delays, or route changes. Dependency-aware monitoring should group related symptoms and direct attention to the most likely upstream cause.
5. Correlate the Evidence
No single metric usually proves the cause of a cloud performance issue.
For example, higher application response time, packet loss, rising WAN discards, and increased traffic at one office may point to a local capacity problem rather than a cloud-wide failure.
Correlation turns separate alerts into a clear diagnosis.
6. Support Remediation and Confirm Recovery
Once the likely cause is identified, the platform can notify the right team, open an incident, or provide the evidence needed for corrective action. Monitoring should continue after the fix. The service, path, interface, and response metrics should return to an acceptable baseline before the incident is considered resolved.
Cloud Network Monitoring vs. Cloud Network Management
Cloud network monitoring and cloud network management are related, but they serve different purposes.
-
Cloud network monitoring observes network health, connectivity, traffic, availability, and performance. It helps teams understand what is happening and investigate abnormal conditions.
-
Cloud network management is broader. It may include monitoring as well as provisioning resources, applying policies, changing routes, controlling access, updating configurations, and initiating remediation.
Cloud observability is broader again. It combines network information with application traces, logs, events, and infrastructure data to explain behavior across the wider technology stack.
|
Area |
Cloud network monitoring |
Cloud network management |
Cloud observability |
|
Main purpose |
Detect and diagnose network conditions |
Operate and control network resources |
Explain behavior across applications and infrastructure |
|
Common data |
Latency, loss, traffic, routes, interfaces, and availability |
Monitoring data, policies, configurations, and inventory |
Metrics, logs, traces, events, and dependencies |
|
Typical actions |
Alert, analyze, report, and diagnose |
Configure, provision, enforce, and remediate |
Investigate system and application behavior |
|
Main users |
Network and infrastructure teams |
Network administrators and platform teams |
CloudOps, DevOps, SRE, and ITOps teams |
|
Primary scope |
Network connectivity and performance |
Network operation and control |
The broader application and infrastructure environment |
What Should Cloud Network Monitoring Track?
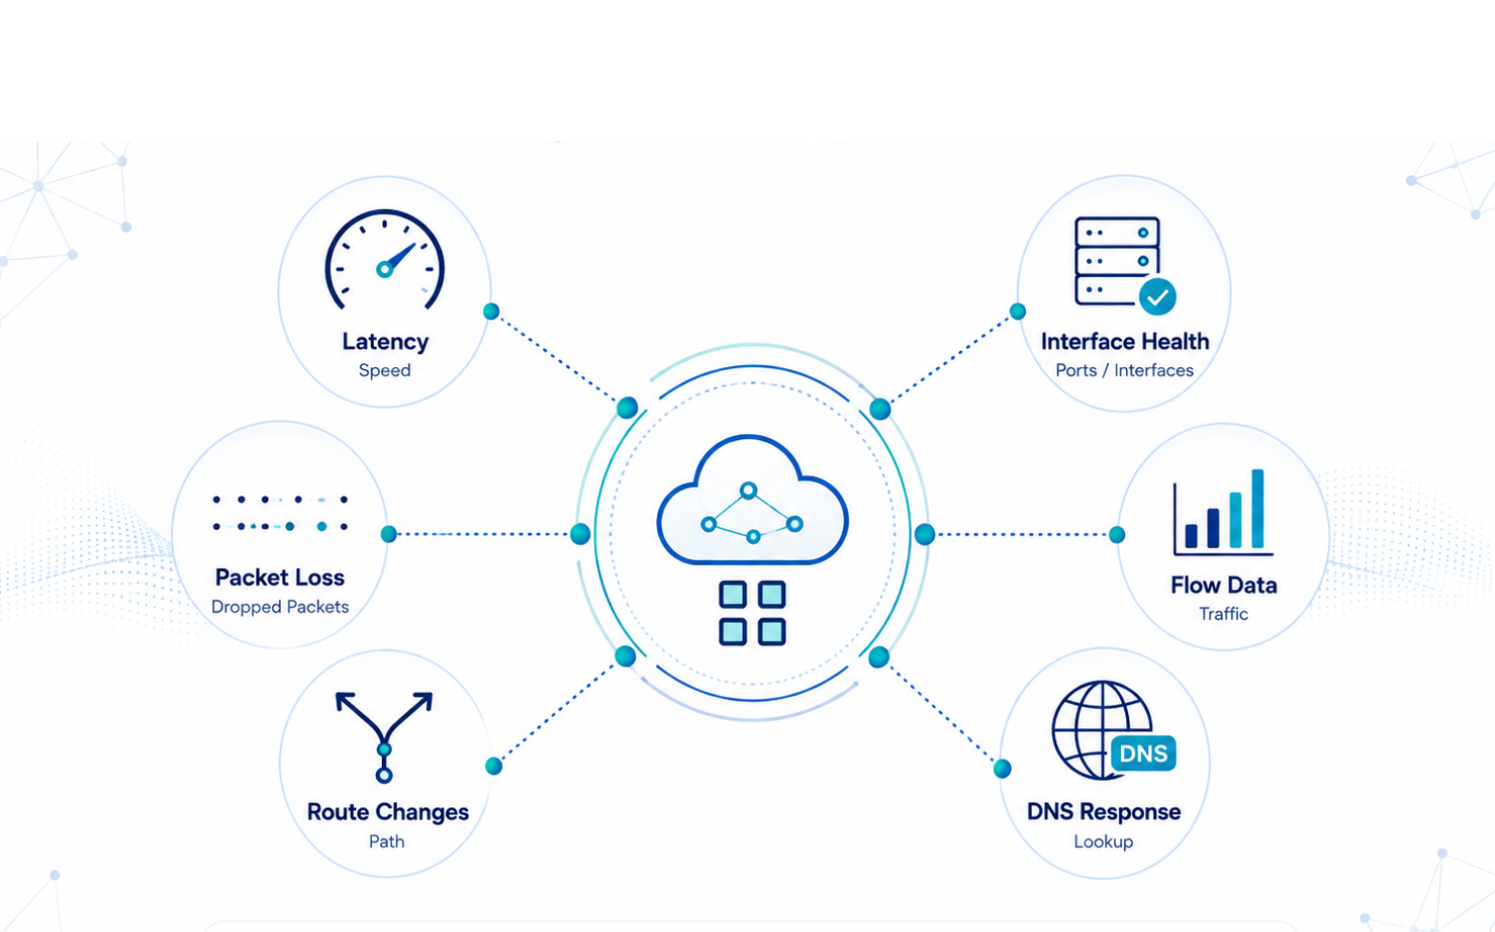
Cloud network monitoring is only useful when it measures signals that help distinguish one possible cause from another.
A status check may confirm that a cloud service is available, but it cannot explain why users are experiencing poor response times. Effective cloud network performance monitoring needs enough evidence to separate congestion from routing problems, interface faults, DNS delays, provider degradation, and cloud-side issues.
The IETF Performance Metrics Registry includes standardized measurements for round-trip latency, packet loss, packet-delay variation, DNS response latency, ICMP performance, and TCP delay. These measurements provide a useful technical foundation for cloud network monitoring.
|
Signal |
What it shows |
What an abnormal result may indicate |
|
Latency |
Time required for traffic to travel between points |
Congestion, longer routes, distant regions, or slow processing |
|
Packet loss |
Traffic that fails to reach its destination |
Link instability, interface faults, congestion, or provider degradation |
|
Jitter |
Variation in packet arrival timing |
Unstable performance affecting voice, video, and real-time traffic |
|
Throughput |
Amount of data successfully transferred |
Capacity restrictions, protocol limitations, or transfer problems |
|
Bandwidth utilization |
Percentage of available link capacity in use |
Congestion risk, heavy applications, or insufficient capacity |
|
Availability |
Whether a device, path, or service is reachable |
Outages, failed dependencies, routing failures, or blocked access |
|
Interface errors |
Invalid or damaged frames and packets |
Cabling, hardware, speed, duplex, or physical-layer problems |
|
Interface discards |
Traffic dropped after reaching an interface |
Congestion, buffer exhaustion, or policy-related dropping |
|
Flow data |
Who is communicating and how much traffic is being generated |
Unexpected applications, traffic spikes, or usage changes |
|
Route changes |
Differences in the path used to reach a destination |
Provider changes, failover, routing instability, or inefficient paths |
|
DNS response time |
Time required to resolve a service name |
DNS server, forwarding, configuration, or upstream problems |
|
Service response time |
Time required for a cloud service to respond |
Network, regional, provider, or application degradation |
Interface Health
- A device may remain online while an interface produces errors, drops packets, or reaches capacity.
- Errors often indicate hardware, cabling, speed, or duplex issues.
- Discards usually point to congestion, buffer pressure, or traffic policies.
Path and Route Visibility
- Cloud traffic may change paths because of BGP updates, WAN failover, provider routing, or SD-WAN policies.
- Network path mapping should retain historical route data.
- This helps engineers see what changed when performance declined.
Traffic-Flow Visibility
- Flow data shows which applications and systems are using bandwidth.
- It helps identify traffic spikes, heavy transfers, and unexpected usage.
- This explains why a link is congested, not just that it is busy.
Operational Measures
- Track mean time to detect, identify, and resolve incidents.
- Monitor false-positive alerts, recurring issues, SLA compliance, and provider escalation time.
- The goal is better troubleshooting outcomes, not more dashboards and alerts.
Common Cloud Network Problems and What to Check
The same user complaint can have very different causes. A useful monitoring strategy connects the observed symptom with the evidence needed to test each possibility.
|
Observed problem |
Possible cause |
Evidence to review |
|
One office is slow while others are normal |
Local congestion, WAN fault, or provider issue |
Interface utilization, errors, discards, packet loss, and flow data |
|
Every location is affected |
Cloud service, DNS, or shared provider failure |
Multi-location tests, provider status, DNS timing, and cloud service response |
|
The service is reachable but slow |
Congestion or inefficient routing |
Latency, route history, utilization, flow volume, and packet loss |
|
Performance declined after failover |
Backup path has lower quality or capacity |
Current path, historical path, jitter, loss, latency, and link capacity |
|
The first connection is slow |
DNS resolution problem |
Resolver response time, forwarding behavior, and DNS availability |
|
Calls or meetings break up |
Jitter, loss, or QoS problem |
Delay variation, packet loss, interface queues, and traffic prioritization |
|
Performance changed after a network update |
Configuration or policy issue |
Route, firewall, SD-WAN, VPN, and device configuration history |
|
A router is online, but users still struggle |
Interface-level fault |
Errors, discards, speed, duplex, utilization, and physical health |
This approach is more reliable than assuming every cloud performance complaint is caused by the cloud provider.
Practical Example: Diagnosing a Slow Cloud Application
A finance team reports that its cloud-based business application is slow at headquarters, even though the provider’s status page shows no outage and the application team confirms normal processing times.
The network team checks the scope first. Only headquarters users are affected, while a second office and remote users continue to see normal performance. That makes a wider cloud outage unlikely.
The team then compares DNS lookup time, connection time, latency, and packet loss across locations. DNS is normal, but headquarters shows higher latency and intermittent packet loss. The WAN interface is still up, yet its discard counter has increased, and utilization is above baseline.
Flow data reveals that an unscheduled data transfer began at about the same time and is consuming much of the WAN capacity. Route monitoring shows that traffic is still using the usual path, and other locations remain unaffected.
The evidence points to local WAN congestion, not a cloud application issue. Once the transfer is limited or rescheduled, utilization drops, discards stop, packet loss disappears, and application performance returns to normal.
Instead of saying, “The cloud application is slow,” the team can reach a clear conclusion: “An unexpected data transfer saturated the headquarters WAN connection, causing discards and packet loss that slowed application access.”
Benefits of Monitoring Cloud Network Performance
Cloud network monitoring helps IT teams understand how network conditions affect access to cloud applications and services.
Its main benefits include:
- End-to-end visibility: Teams can monitor the local network, WAN links, internet providers, interfaces, routes, cloud networks, and service endpoints involved in delivering an application.
- Faster fault isolation: Correlating latency, packet loss, interface errors, traffic, route changes, and service response data helps narrow the source of a problem before several teams become involved.
- Earlier warning of performance risk: Historical baselines can reveal increasing utilization, unstable routes, recurring packet loss, or gradual degradation before a wider disruption occurs.
- Stronger support for distributed environments: Centralized monitoring allows teams to compare performance across offices, remote users, cloud regions, providers, and hybrid networks.
- Better capacity decisions: Historical utilization and traffic patterns help teams decide when WAN links, internet capacity, cloud connections, or traffic policies need to change.
- Clearer provider escalation: Recorded latency, route, availability, and packet loss data gives teams stronger evidence when raising an issue with an ISP, carrier, SaaS provider, or cloud vendor.
These benefits depend on the quality of the underlying data. A centralized dashboard adds little value if it cannot see enough of the service path to distinguish a cloud-side problem from an enterprise or provider-network issue.
Common Monitoring Limitations and Blind Spots
Cloud network monitoring can improve visibility, but no platform sees every component or explains every incident automatically.
Organizations should plan for the following limitations:
- Incomplete coverage across providers and environments: Cloud and SaaS providers expose different APIs, logs, and metrics. A platform may also have strong visibility inside the cloud while missing the enterprise WAN, local interfaces, or external provider path.
- Telemetry volume and cost: Frequent polling, flow records, packet capture, detailed logs, and long retention periods can increase processing, storage, and licensing requirements.
- Alert fatigue: Poorly chosen thresholds can create several alerts from one upstream incident. Dependency mapping, correlation, and suppression are needed to keep alerts useful.
- Dynamic resources: Cloud interfaces, workloads, addresses, and routes may change automatically. Static inventories and manually maintained rules can quickly become inaccurate.
- Security and governance requirements: Monitoring systems may handle credentials, configurations, API access, traffic metadata, and operational logs. Access control, encryption, auditing, retention, and data residency still need careful management.
- Deployment tradeoffs: A cloud-hosted platform may simplify remote access, while an on-premises or hybrid model may provide greater control over internal telemetry or sensitive data.
These limitations do not reduce the value of monitoring. They explain why coverage, integration quality, deployment architecture, and data access need to be evaluated before a platform is selected.
Cloud Network Monitoring Best Practices
Start With Critical Services
Begin with the cloud applications the organization depends on most.
Identify who uses them, which offices and networks support them, where they are hosted, which providers carry the traffic, what normal performance looks like, and who owns the response when something goes wrong.
This keeps the monitoring program tied to service impact rather than producing an unstructured collection of device statistics.
Map the Full Service Path
Monitoring should extend beyond the cloud workload.
Map the path from the user through the local network, firewall, WAN or internet connection, DNS service, cloud gateway, virtual network, and application endpoint.
This reveals where visibility is missing and which components need to be analyzed together.
In an SD-WAN environment, traffic may move dynamically between circuits. Effective SD-WAN monitoring should show the performance of individual links and the routes used to reach important endpoints.
Combine Active and Passive Evidence
Use synthetic tests to measure what users experience and passive telemetry to explain the cause.
DNS, ICMP, TCP, and HTTP tests can show that a service is slow or unreachable. Interface statistics, flow records, routes, configurations, logs, and provider metrics help determine why.
The two approaches should complement one another rather than produce duplicate data.
Build Service-Specific Baselines
Do not rely on thresholds copied from another network.
Observe normal performance across different offices, business hours, quiet periods, seasonal workloads, primary paths, backup paths, and application types.
Then define alerts around meaningful changes and service expectations.
Monitor From Several Locations
A cloud service may perform normally from one office and poorly from another because the two locations use different providers, circuits, DNS resolvers, or routes.
Testing from several locations helps separate local incidents from regional, provider-wide, or application-wide problems.
Track Network Changes
Many incidents begin after a configuration or policy change.
Monitor changes to routes, firewalls, SD-WAN rules, VPNs, cloud route tables, gateways, security controls, and network devices.
Change history gives engineers a useful starting point when performance shifts unexpectedly.
Make Alerts Actionable
A useful alert should explain what changed, when it changed, which users or services are affected, where the condition exists, and which evidence supports the finding.
“Latency is high” is a symptom. “Latency increased for headquarters users after traffic moved to the backup WAN path” gives the engineer somewhere to begin.
Test Failures Before They Happen
Do not wait for a real outage to discover that monitoring coverage is incomplete.
Test WAN failover, DNS failure, packet loss, congestion, route changes, gateway failure, and provider degradation. Confirm that the monitoring system detects the condition, identifies the affected service, and directs the alert to the right team.
Review Coverage Regularly
Networks change.
Monitoring should be reviewed after cloud migrations, provider changes, office openings, network redesigns, mergers, major application launches, and SD-WAN policy updates.
A monitoring design that represented the network accurately a year ago may now contain serious blind spots.
How to Evaluate a Cloud Network Monitoring Platform
Choose a platform according to the environment it must observe and the problems it must help diagnose. Do not compare tools only by dashboard design or the number of features listed on a product page.
Evaluate:
- Coverage: Can it monitor the devices, interfaces, cloud services, branch offices, WAN links, remote users, and hybrid or multi-cloud paths that matter?
- Telemetry: Does it support the required SNMP data, flow records, syslog, cloud APIs, routes, synthetic tests, configuration changes, and interface counters?
- Path visibility: Can it show how users reach a cloud service and whether the route changed when performance declined?
- Diagnostic depth: Can it identify the affected interface, congested link, unusual traffic source, packet loss, route, or configuration change, or does it only report that latency is high?
- Alert quality: Does it offer dependency awareness, duplicate suppression, historical context, severity controls, ownership rules, and integration with existing incident workflows?
- Deployment fit: Does the cloud-hosted, on-premises, or hybrid architecture meet the organization’s security, data-residency, credential, and administrative requirements?
- Scalability: Can it support the expected number of devices, interfaces, locations, flow records, polling intervals, and retention requirements?
- Usability: Can network engineers reach a diagnosis without relying on one specialist who understands the platform?
The most revealing evaluation is not a standard product demonstration. Give the vendor a realistic incident to investigate.
Ask the team to show how the platform would diagnose poor access to a cloud application from one office while other locations remain unaffected. That scenario exposes the difference between a platform that displays data and one that supports real troubleshooting.
Final Thoughts
Start by identifying the cloud services your teams depend on most and mapping the network paths users take to reach them. Then confirm that your monitoring covers the right interfaces, routes, traffic flows, DNS services, and cloud connections. Establish normal performance baselines, test alerts with real failure scenarios, and close any visibility gaps you find. The next step is to evaluate whether your current tools can move from detecting symptoms to identifying the actual cause.
Frequently Asked Questions About Cloud-Based Network Monitoring
What Are Cloud-Based Network Monitoring Tools?
Cloud-based network monitoring tools track network availability, traffic, latency, packet loss, devices, interfaces, and routes across cloud and hybrid environments. They help IT teams detect performance issues and identify whether the problem originates in the local network, provider path, or cloud service.
How Do Cloud-Based Network Monitoring Tools Work?
These tools collect data from network devices, cloud platforms, interfaces, traffic flows, logs, and synthetic tests. They compare current performance with normal baselines, detect unusual conditions, generate alerts, and provide evidence that helps teams isolate the likely cause.
Do Cloud-Based Network Monitoring Tools Require Agents?
Not always. Many network conditions can be monitored through SNMP, flow records, syslog, cloud APIs, interface counters, and synthetic tests. Agents or local collectors may still be required for deeper endpoint, application, or operating-system visibility.
What Is the Difference Between Cloud-Based and On-Premises Network Monitoring?
Cloud-based monitoring hosts the management and analysis platform in the cloud, while on-premises monitoring runs within an organization’s own infrastructure. Cloud-based tools often simplify remote access, while on-premises tools may provide greater control over internal data and deployment.
Do Cloud Monitoring Tools Replace AWS, Azure, or Google Cloud Monitoring?
Not necessarily. Provider-native tools offer detailed visibility into their own cloud environments. A broader network monitoring platform can add visibility across enterprise devices, WAN links, internet providers, branch offices, and multiple cloud services. Many organizations use both approaches together.



.webp)
.jpg)