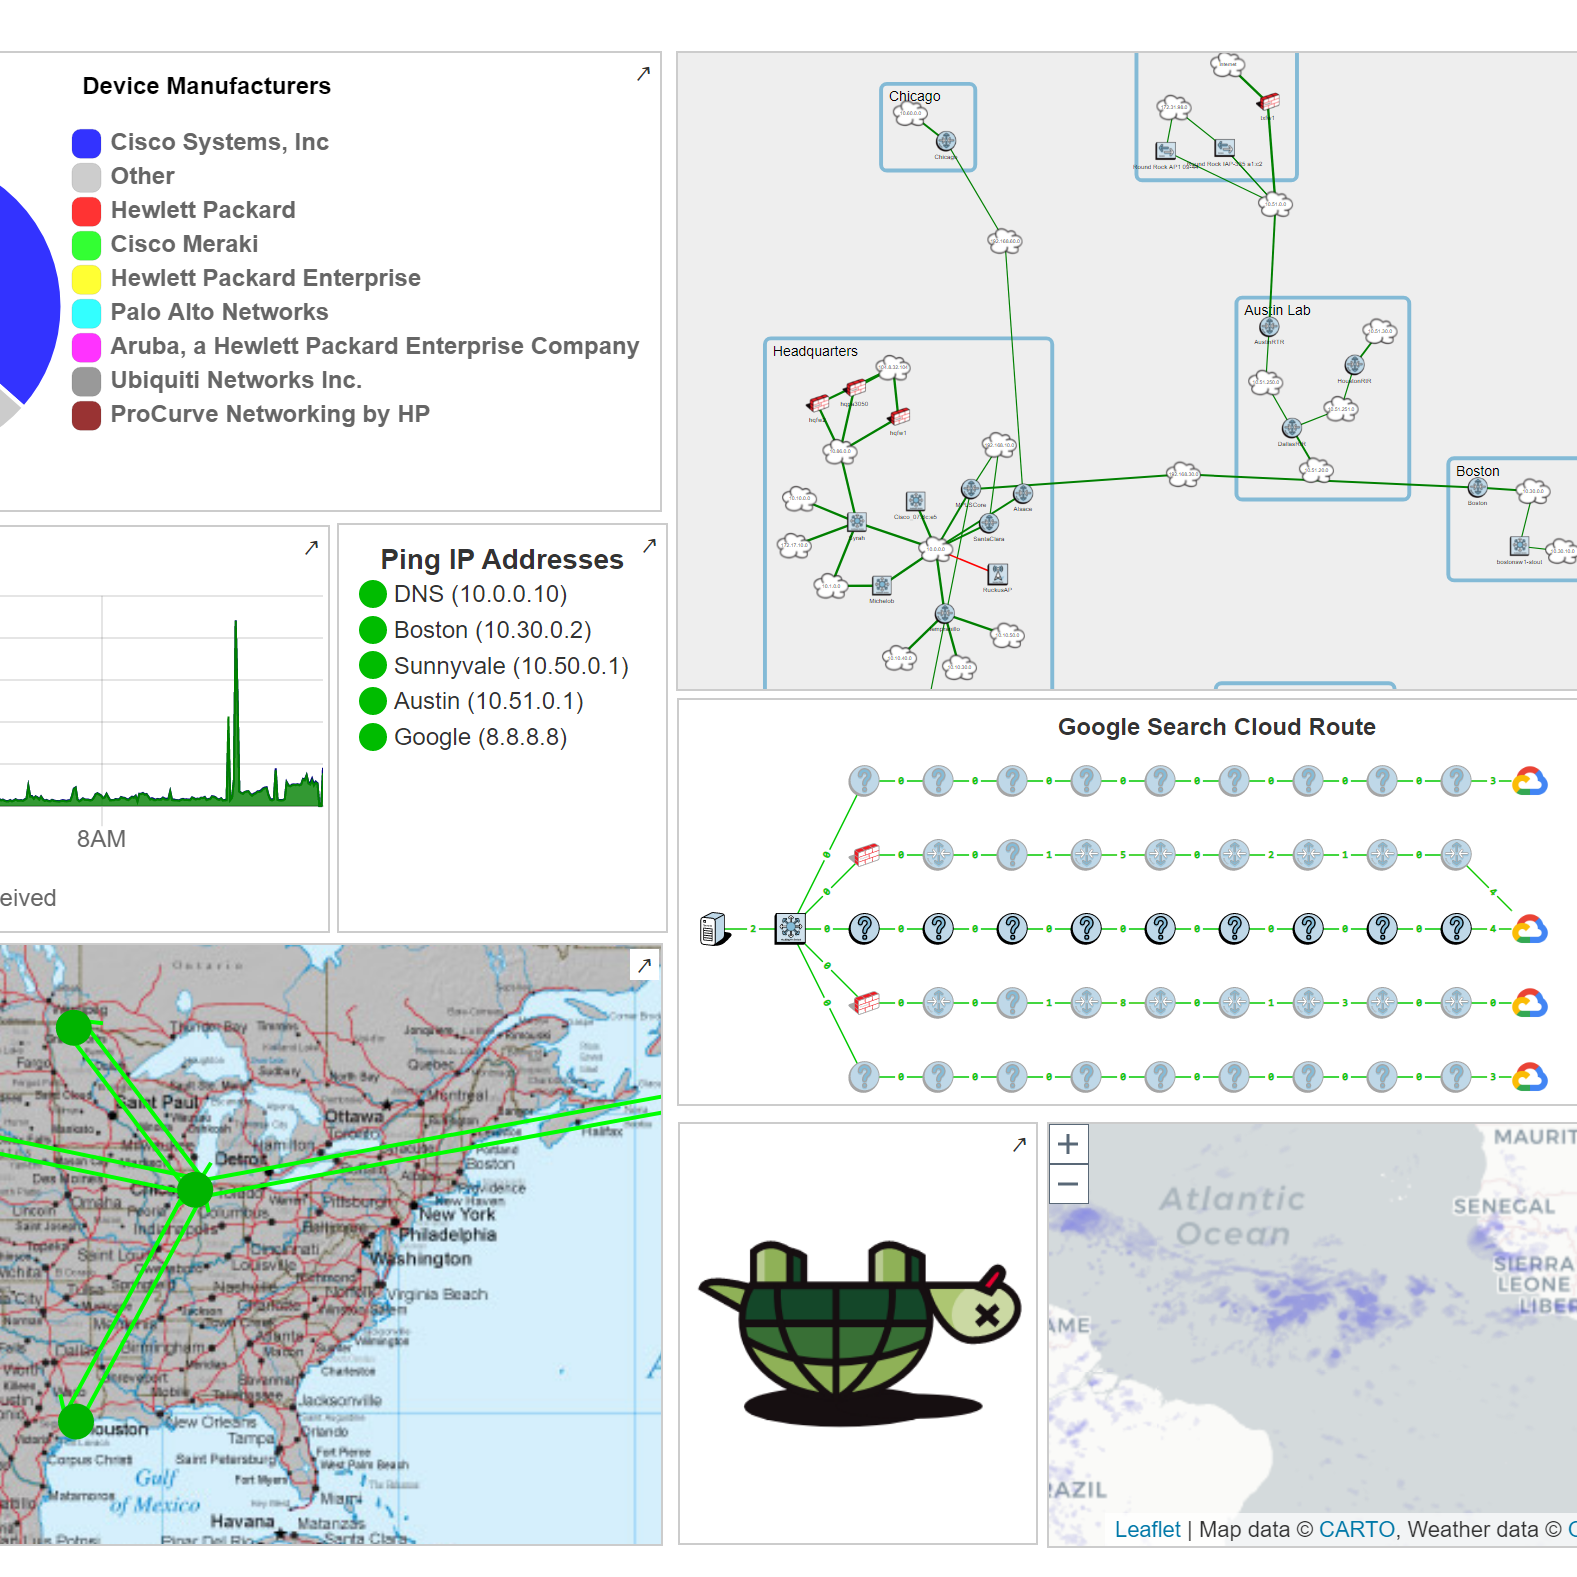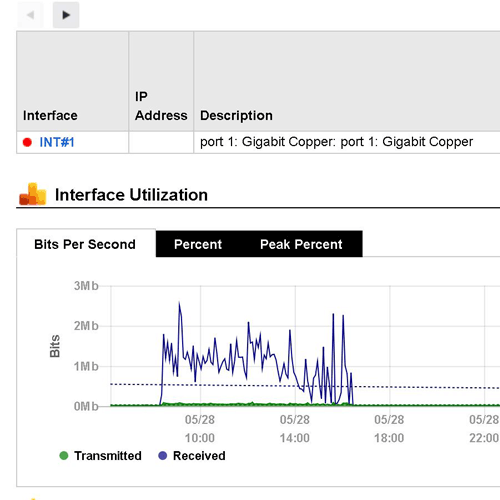


TotalView® bridges the gap between network monitoring and troubleshooting, telling you exactly when, where and why your problem occurred in a matter of minutes.
View the list features that are included in the core TotalView® package.


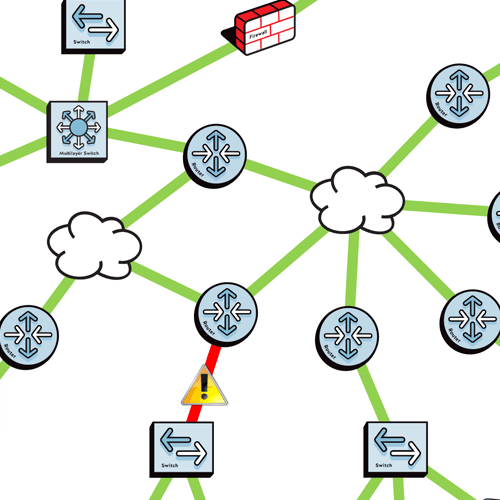
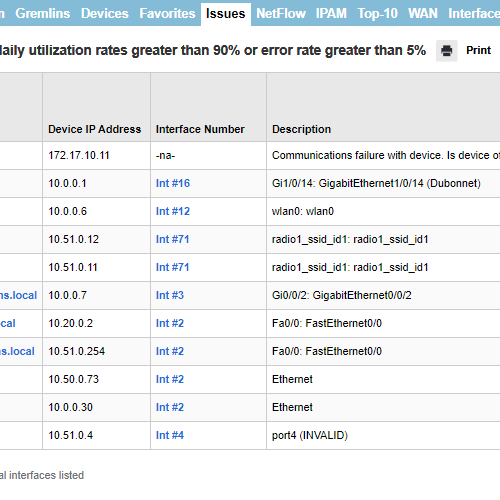
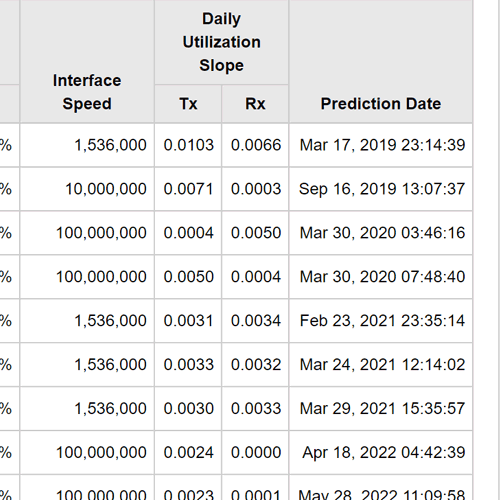
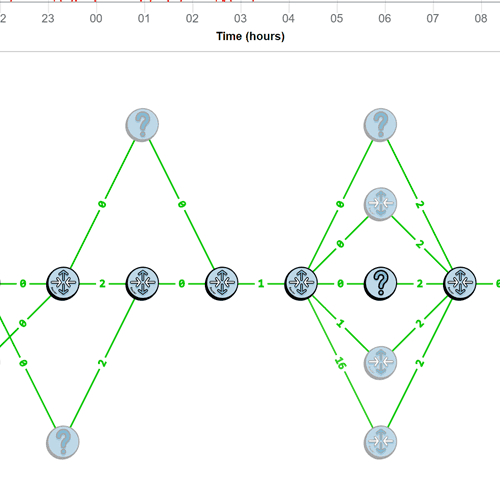
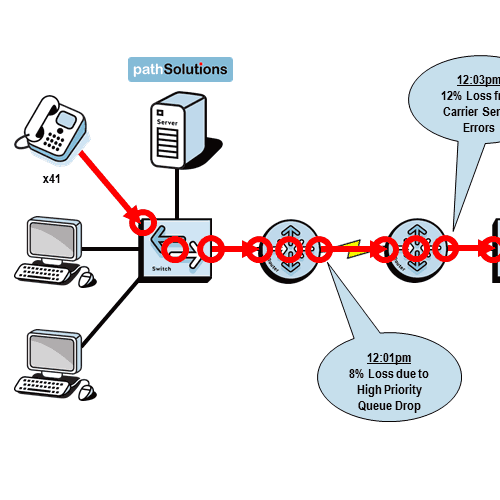
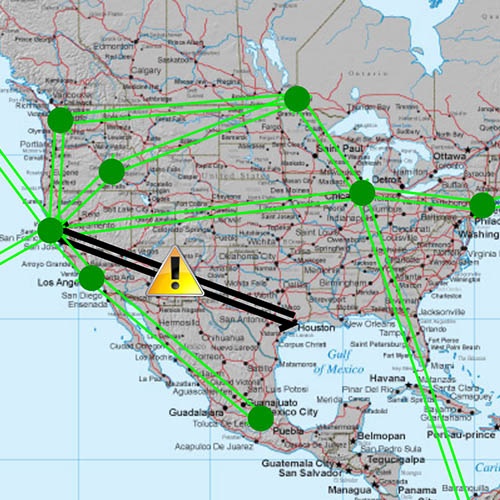
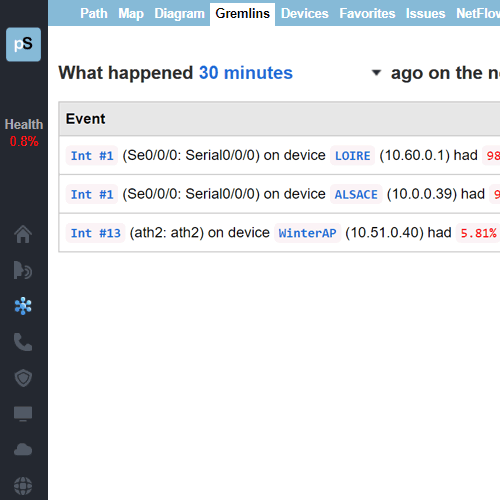
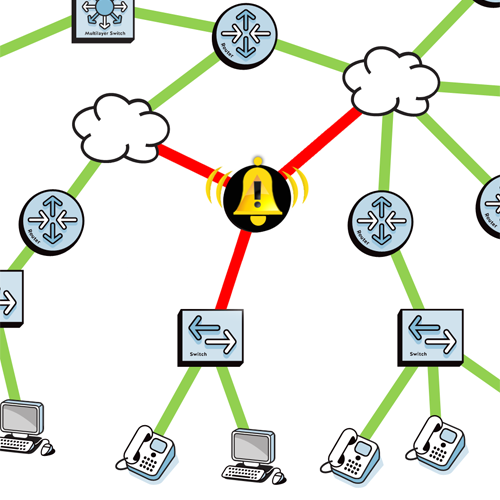
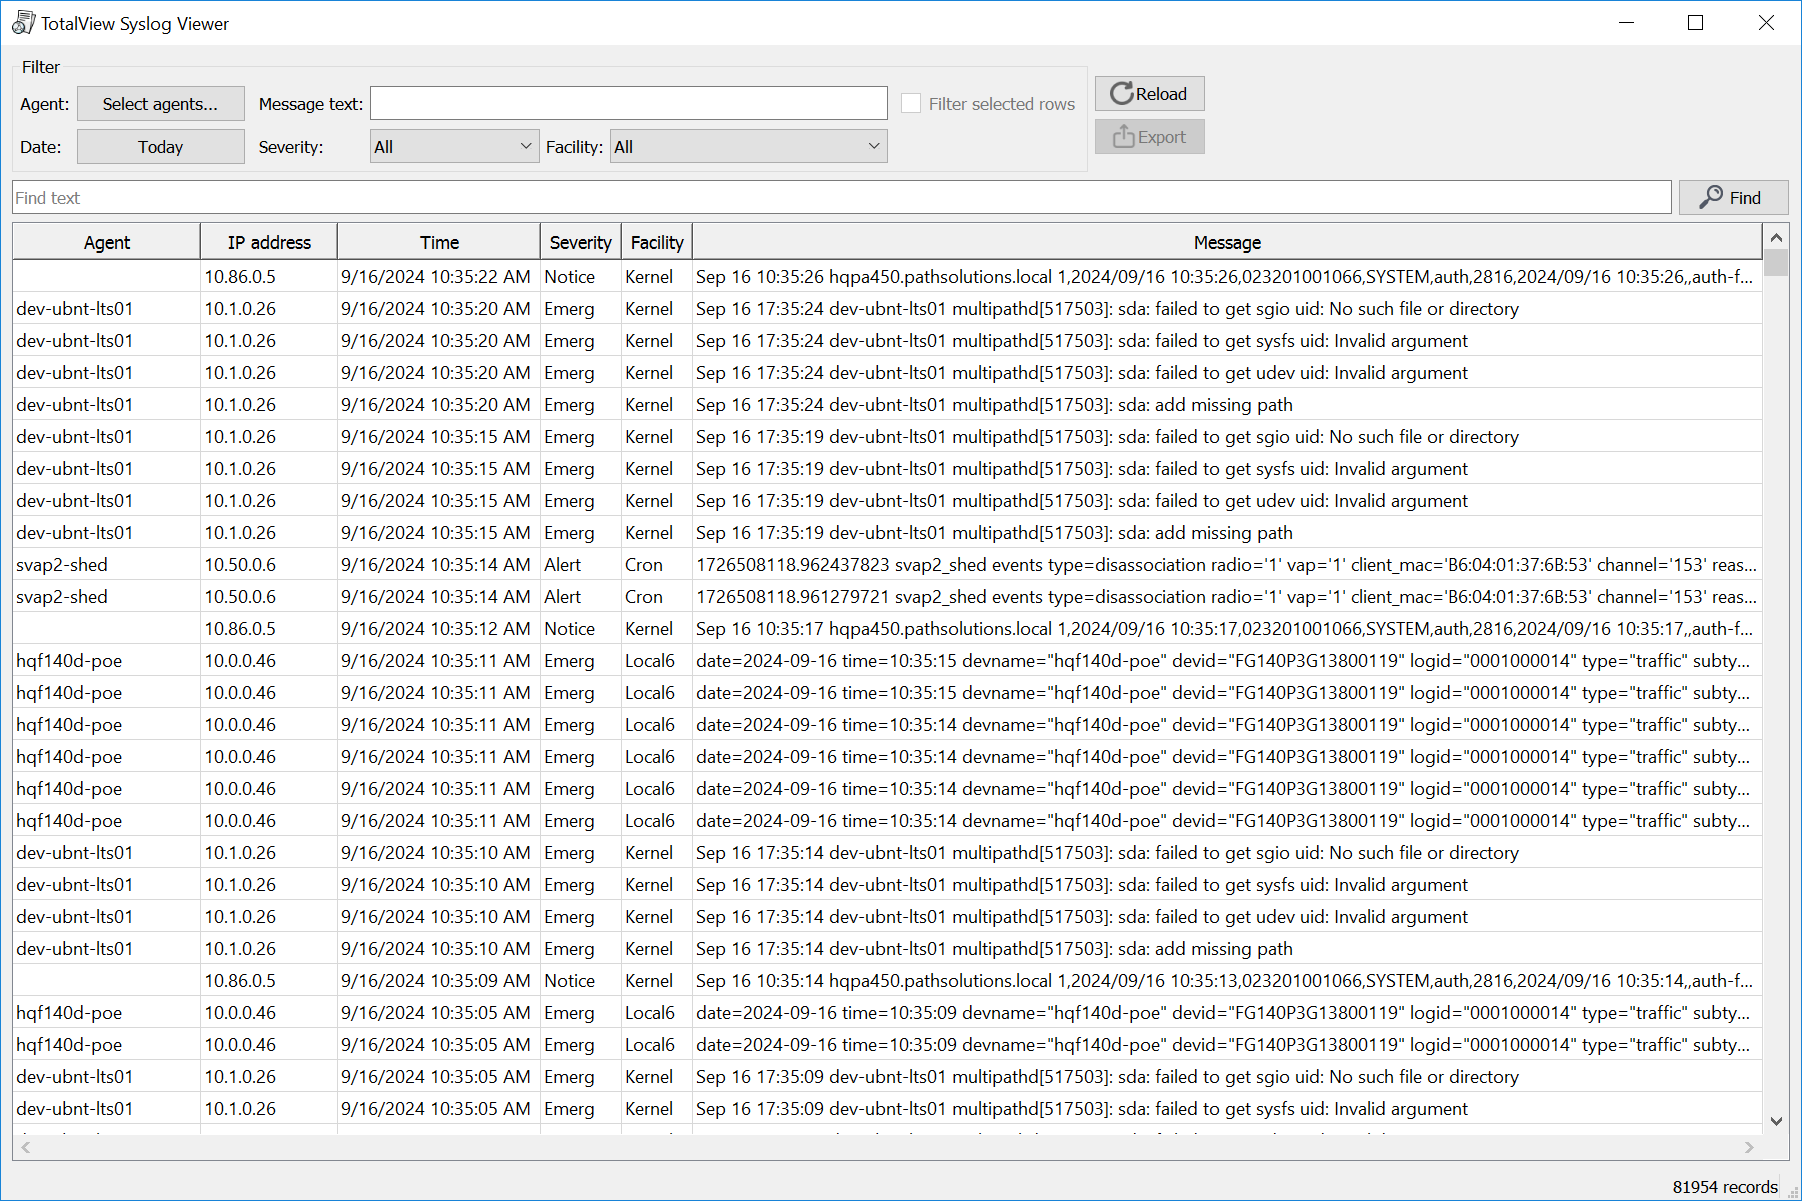
Network Root-Cause Troubleshooting
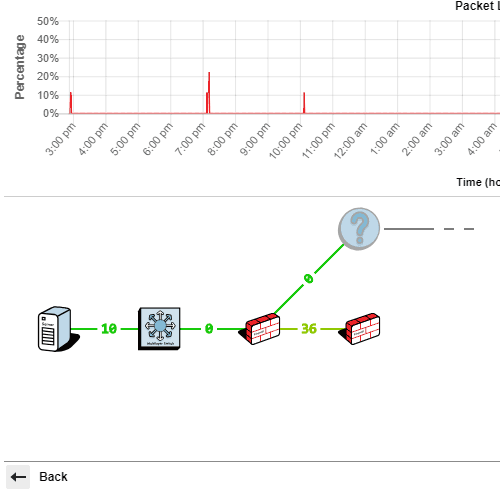
Four Stages of Network Troubleshooting
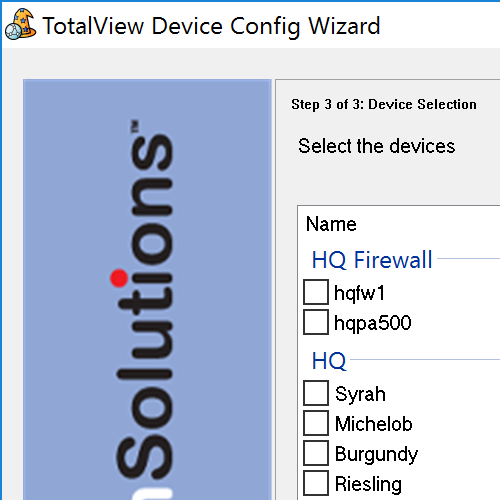
Check off the options that you are required to manage.
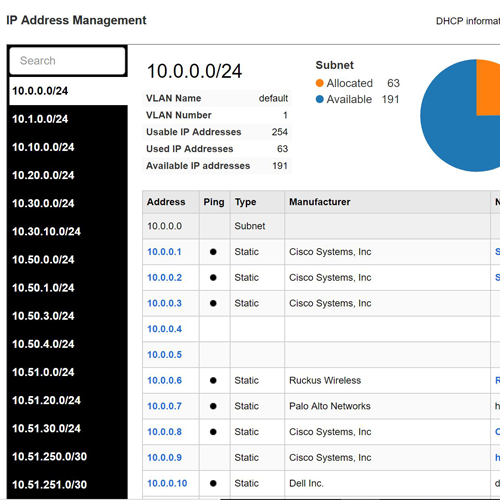
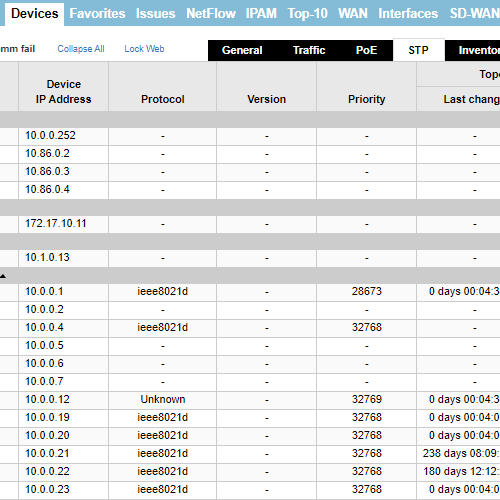
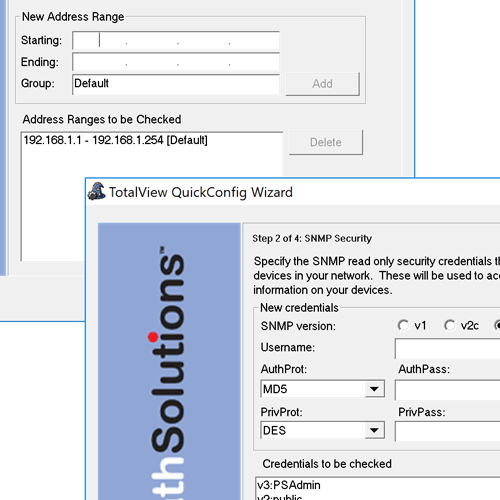
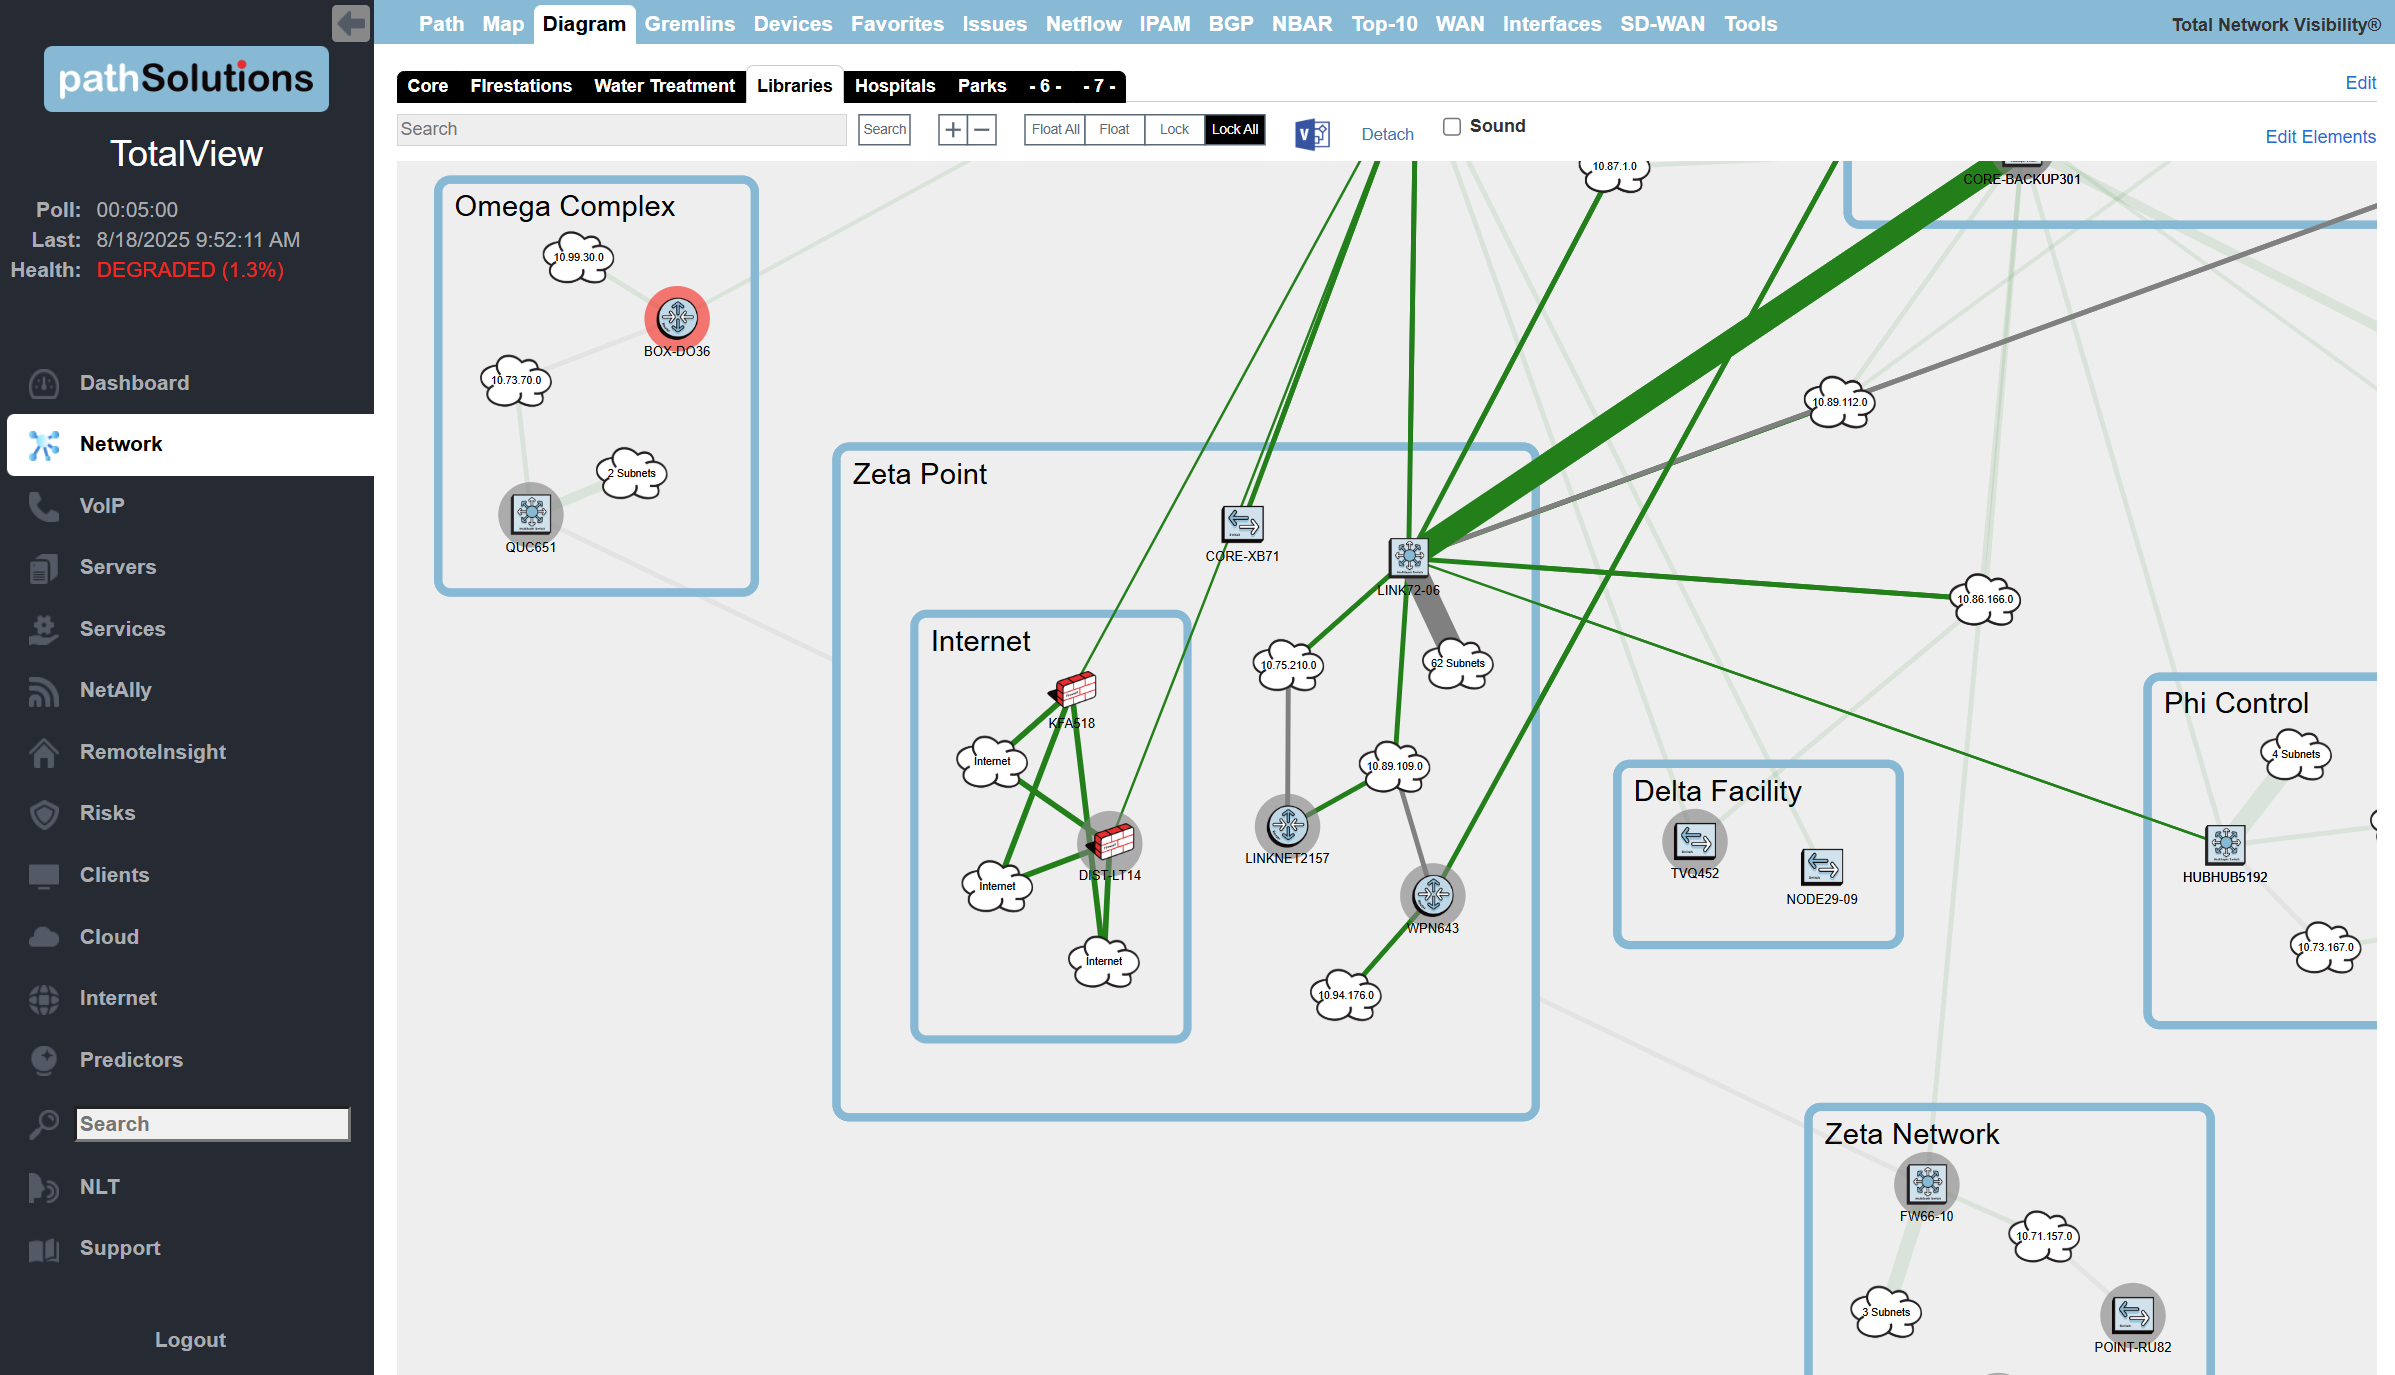
Set IP Address and Subnet Allocation
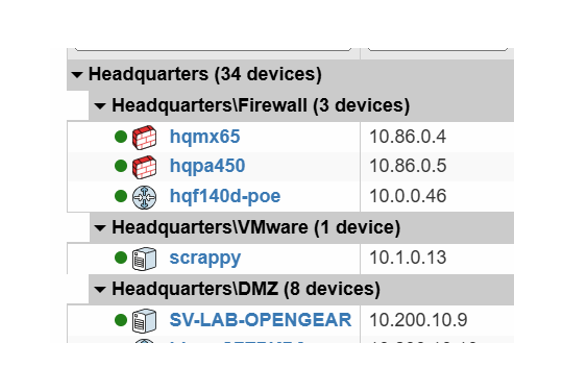
Product Details
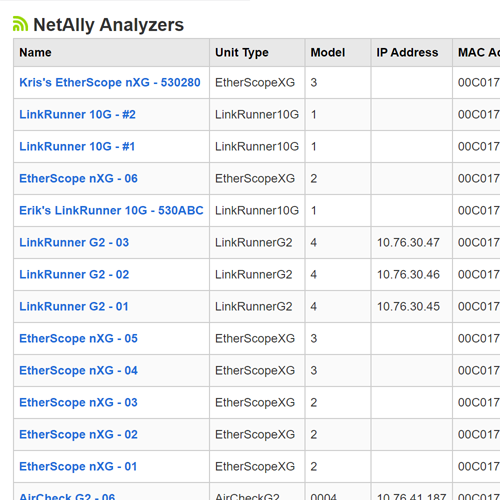
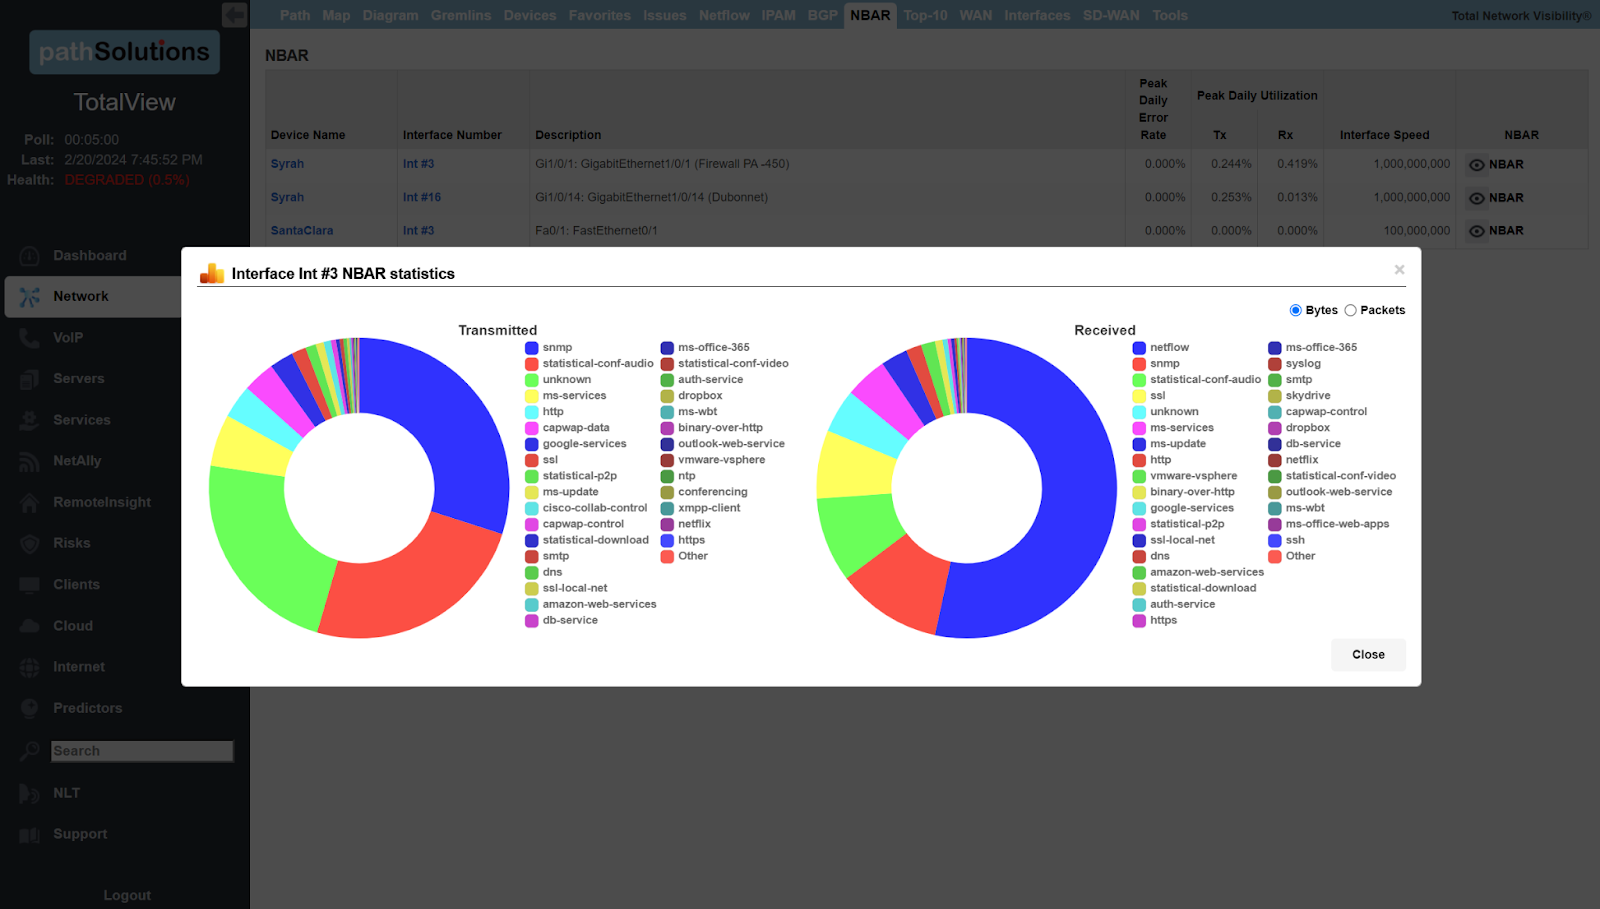
Restful JSON front end, SQLite database, NetAlly integration and PaloAlto integration