

 If a user calls to complain about a problem like a slowdown or VoIP/UC problems, will your Network Performance Monitoring solution be helpful?
Sadly, in many cases, the NPM solution will show that everything is healthy when users are having problems. This means that the monitoring solution is disconnected from the reality of your users, and you’re left having to solve the problem by logging into switches, routers, gateways, and firewalls to manually hunt down the problem.
Even worse, if the problem isn’t happening when you go looking, you’ll never find it. At this point, you could tell the user: “maybe the next time it happens we’ll get a bit closer to finding the source and cause of the problem”.
But that doesn’t install faith with the user or your management that you really know what’s going on, as the problem will probably have to happen multiple times before it gets narrowed down.
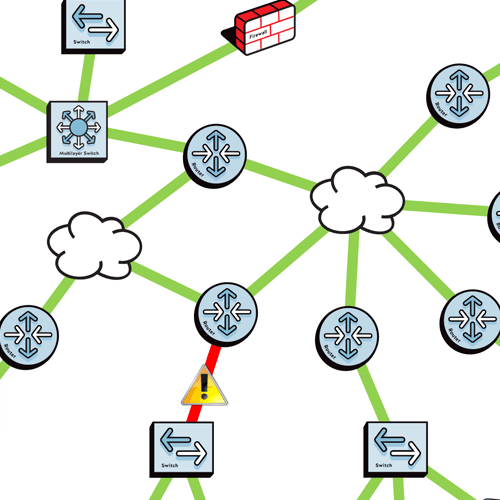
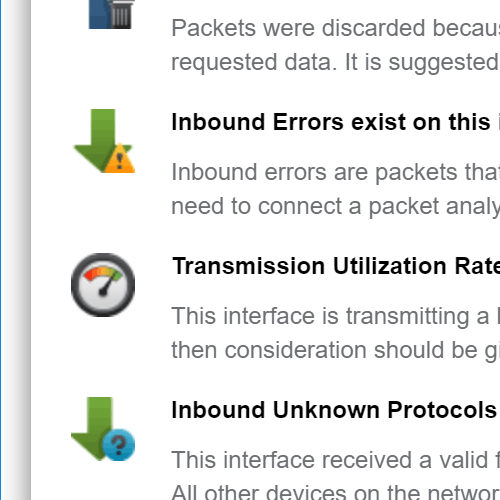
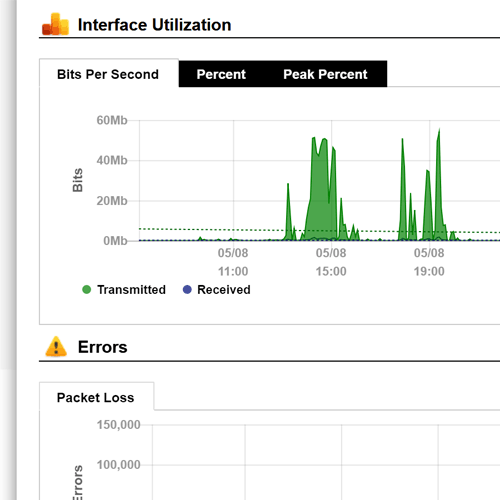
What’s missing? Your network equipment knows everything that is happening on the network, but this information is trapped inside error counters and configuration options that have to be manually collected and interpreted when you’re looking for the source and cause of problems.
This can amount to a lot of work and interpretation when trying to root-cause troubleshoot problems.
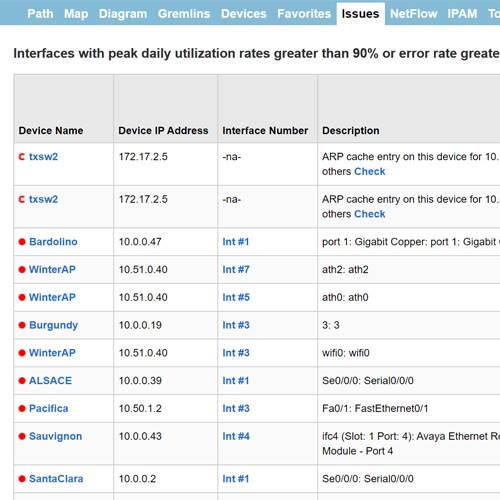
If you consider every time you login to the CLI to try to find or resolve a problem, it means that a manual process had to be used, and there’s no guarantee that the problem will be solved because a lot of information is not presented via the CLI – it has to be queried via SNMP and then correlated to determine what’s actually happening.
With most monitoring systems, you have to go through a multi-step process to find the problem:
- Determine the data needed to solve the problem.
- Determine if your network equipment supports the information (SNMP OID, flow type, etc.).
- Attempt to collect the information and evaluate if the device is providing valid data (many times, alternate OIDs have to be queried because the primary source is not properly supported).
- Interpret the data. This may involve doing many hours of research to determine what’s happening, or it may send you back looking for more data to correlate the event.
The problem with all of the above is that you are the network expert and must handle all of these issues, one way or the other. You don’t want to be the individual who solves all of the problems at your company. (Otherwise you’ll never get a day off!)
I wished to build a network performance monitoring solution that includes automated root-cause troubleshooting. This way, problems can be solved faster because the right information is automatically queried from network devices, and automatically interpreted so problems get solved quickly and easily the first time.